Illinois Population Map
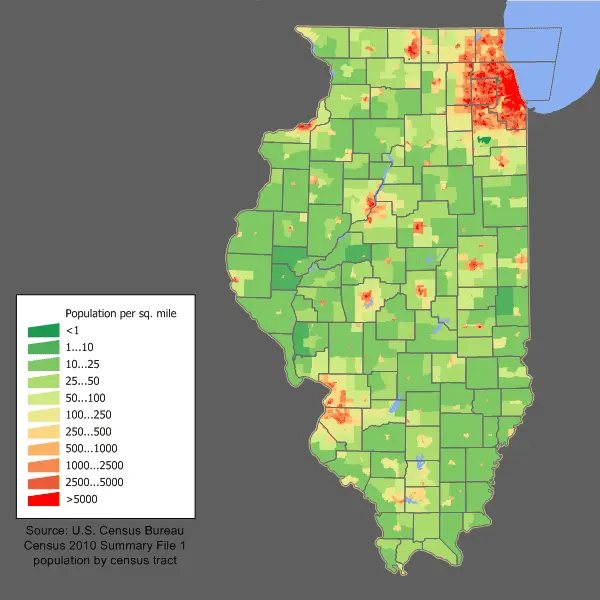
Click or tap the map to enlarge it.
Key Takeaways
- Illinois Population Map provides a visual representation of population distribution in the state.
- It helps researchers, policymakers, and urban planners understand population patterns and trends.
- The map provides valuable insights into areas of growth, urbanization, and demographic changes.
- By analyzing the map, one can identify areas with high population density as well as areas with sparse populations.
- Understanding population distribution is crucial for resource allocation, infrastructure development, and policy formulation.
History
The Illinois Population Map has evolved over the years to meet the changing needs of researchers and the public. The first
population maps of Illinois were drawn in the early 19th century, but they were basic representations with limited data.
As technology advanced, more comprehensive and accurate population maps were created using census data, satellite imagery,
and geographic information systems (GIS).
In the late 20th century and early 21st century, computer-based mapping software allowed for the development of interactive
population maps. These maps make it easier for users to explore population patterns using various visualization techniques,
such as heat maps and dot density maps. The introduction of online mapping platforms and data-sharing initiatives further
democratized access to population maps.
Unique Insights
The Illinois Population Map offers several unique insights into population distribution and its implications. Some of the key
insights include:
- The urban areas of Chicago, Springfield, and Rockford have the highest population densities.
- Rural regions, particularly in southern Illinois, have lower population densities and are characterized by vast open spaces.
- The map reveals population growth corridors along major transportation networks, such as interstates and rail lines.
- Population density tends to decrease as one moves further away from urban centers.
- Changes in population density over time can indicate shifting socioeconomic patterns.
Facts about Illinois Population Map
| Year | Population (in millions) | Key Fact |
|---|---|---|
| 1950 | 8.8 | Post-World War II population growth |
| 1980 | 11.4 | Rise in suburbanization |
| 2000 | 12.4 | Emergence of exurban areas |
| 2020 | 12.8 | Steady population growth with urban focus |
Frequently Asked Questions (FAQ)
-
What is the purpose of the Illinois Population Map?
The purpose of the Illinois Population Map is to visually represent the distribution of the state’s population.
-
How can the map assist policymakers?
The map provides valuable insights for policymakers in resource allocation, infrastructure planning, and policy formulation.
-
Where can I access the Illinois Population Map?
The Illinois Population Map can be accessed through various online mapping platforms and state government websites.
-
What data sources are used to create this map?
The map is created using data from the United States Census Bureau, satellite imagery, and geographic information systems.
-
Can I explore population trends over time?
Yes, the map allows users to analyze population changes over different years and observe long-term demographic trends.
-
How often is the Illinois Population Map updated?
The map is typically updated after each decennial census and may be regularly maintained with additional data sources.
-
Are there any privacy concerns with using the Illinois Population Map?
The map protects individual privacy by aggregating data at the geographic level, ensuring anonymity for residents.