Percentage Population Undernourished World Map
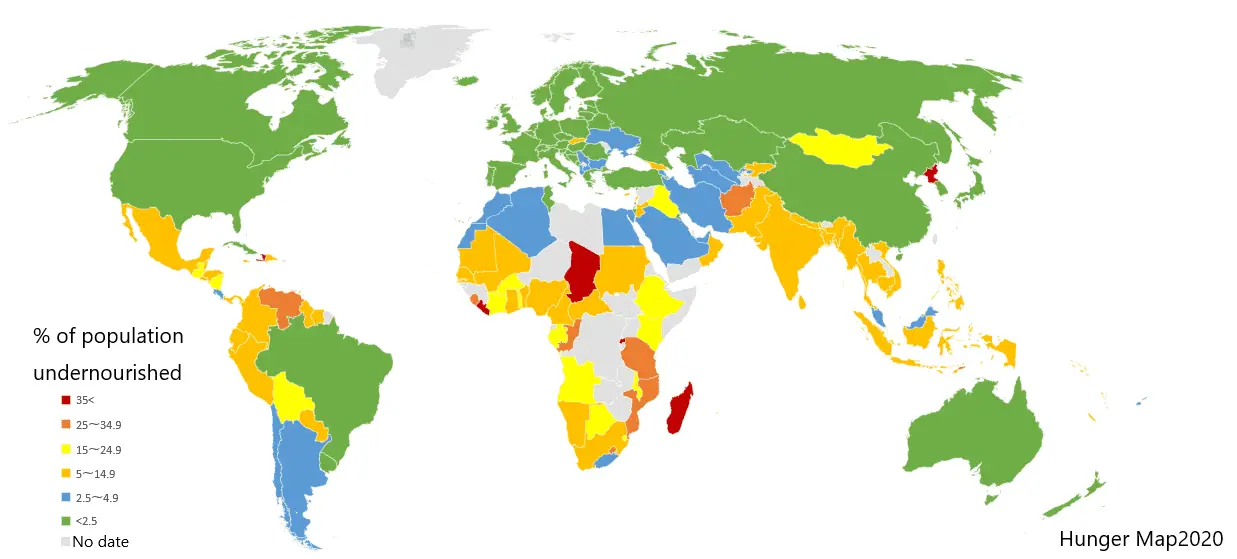
Click or tap the map to enlarge it.
Percentage Population Undernourished World Map
Key Takeaways:
- The Percentage Population Undernourished World Map provides a visual representation of global hunger.
- It highlights regions with a high prevalence of undernourishment.
- The map serves as a useful tool for understanding food security and targeting interventions.
- Monitoring changes in undernourishment levels across countries is crucial for sustainable development goals.
- The map aids policymakers, organizations, and researchers in addressing global hunger challenges.
History
The Percentage Population Undernourished World Map has been developed and regularly updated by international organizations such as the Food and Agriculture Organization (FAO) of the United Nations. It combines reliable data sources, advanced mapping techniques, and statistical analysis to present accurate and up-to-date information on global hunger.
The FAO initiated efforts to map undernourishment in the early 1990s as part of their mission to eliminate hunger and improve food security globally. Over the years, the methodologies and data sources have evolved, leading to more precise and comprehensive maps.
Unique Insights
The Percentage Population Undernourished World Map provides unique insights into the distribution and prevalence of undernourishment across different regions of the world. Some of the key insights include:
- Sub-Saharan Africa and parts of South Asia consistently show higher levels of undernourishment compared to other regions.
- Conflict-afflicted areas often experience severe undernourishment due to disrupted food production and distribution systems.
- Certain regions, despite having overall lower prevalence, have specific populations or communities that face significant undernourishment challenges.
- The map allows for easy comparison between countries, allowing policymakers and researchers to identify regions with successful interventions and areas that require increased attention.
- Changes in undernourishment levels over time can be analyzed, helping identify progress and areas where additional efforts are needed.
Table: Relevant Facts on Undernourishment
| Year | Estimated Global Undernourished Population (in millions) |
|---|---|
| 1990 | 823 |
| 2000 | 793 |
| 2010 | 925 |
| 2020 | 811 |
Frequently Asked Questions
Q1: How is undernourishment defined?
Undernourishment is defined as the condition where individuals lack sufficient food energy intake over a prolonged period, leading to poor physical and mental health.
Q2: Is undernourishment a widespread issue?
Yes, undernourishment remains a significant global challenge. Despite progress in reducing the number of undernourished people, millions still suffer from hunger and malnutrition.
Q3: What are the main causes of undernourishment?
The main causes of undernourishment include poverty, conflict, climate change, lack of access to resources, inadequate agricultural practices, and limited social safety nets.
Q4: How can the Percentage Population Undernourished World Map be used?
The map can be used by policymakers, organizations, and researchers for various purposes, including targeting interventions, assessing progress, identifying high-risk areas, and supporting evidence-based decision-making.
Q5: What efforts are being made to address undernourishment globally?
Efforts to address undernourishment globally include promoting sustainable agriculture, improving access to nutritious food, implementing social protection programs, supporting small-scale farmers, enhancing agricultural productivity, and strengthening policy frameworks.
Q6: How often is the map updated?
The Percentage Population Undernourished World Map is typically updated annually, incorporating the latest available data to provide an accurate depiction of the current state of undernourishment globally.
Q7: How can individuals contribute to reducing undernourishment?
Individuals can contribute to reducing undernourishment by supporting organizations working towards food security, advocating for sustainable agricultural practices, reducing food waste, and promoting equitable access to nutritious food.