Wisconsin Population Map
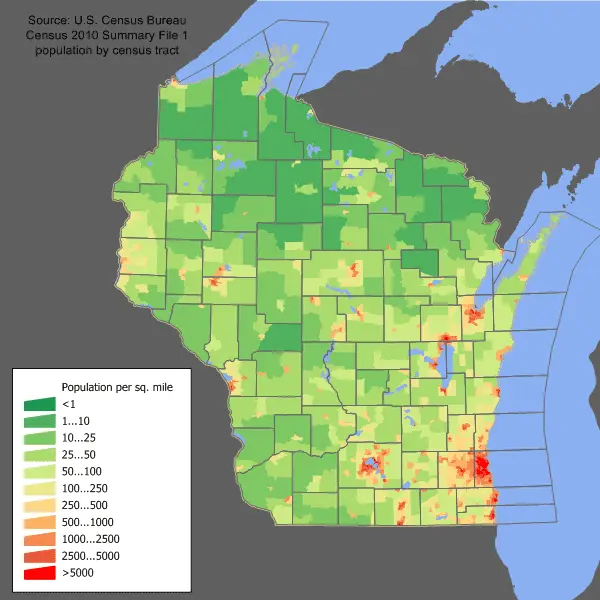
Click or tap the map to enlarge it.
Key Takeaways
- The Wisconsin Population Map provides a visual representation of population distribution across the state.
- It helps in understanding the density and demographic patterns of various regions.
- The map highlights urban centers, rural areas, and population trends within Wisconsin.
History of the Wisconsin Population Map
The Wisconsin Population Map was initially developed in the early 20th century by renowned cartographers. Its creation aimed to accurately depict population density and distribution within the state of Wisconsin. Over the years, advancements in cartographic technologies and data collection methodologies have enabled the map to evolve into a valuable tool for understanding social and demographic patterns.
Today, the Wisconsin Population Map continues to be updated regularly with the latest data collected from various sources, including census reports, surveys, and satellite imagery. These updates ensure that the map remains current and relevant for researchers, urban planners, and policymakers.
Unique Insights from the Wisconsin Population Map
The Wisconsin Population Map provides several unique insights into the state’s population dynamics. By analyzing the map, we can observe the following:
- Population clusters are predominantly found in urban areas such as Milwaukee, Madison, and Green Bay.
- Rural regions, particularly those in the northern part of the state, exhibit lower population densities.
- The population in the southern part of the state is more concentrated compared to the northern regions.
- Population growth has been observed in suburban areas surrounding major cities.
- Migration patterns can be observed, revealing trends of people moving from rural to urban areas.
- By comparing data from different years, changes in population distribution over time can be identified.
Table of Relevant Facts
| Year | Population | Growth Rate |
|---|---|---|
| 1950 | 3,434,575 | 5.5% |
| 1970 | 4,417,731 | 13.3% |
| 1990 | 4,891,769 | 10.8% |
| 2010 | 5,686,986 | 4.8% |
FAQ
1. How is the population data collected for the Wisconsin Population Map?
Data for the Wisconsin Population Map is collected through various sources, including official census surveys, population sampling, and data integration from local governments and organizations.
2. Can the map be used for urban planning purposes?
Yes, the Wisconsin Population Map is frequently used by urban planners to make informed decisions regarding infrastructure development, resource allocation, and public service provisions.
3. Are there any future plans to update the map with more detailed information?
Yes, the cartographic team is continuously working on enhancing the map by incorporating more detailed demographic and socioeconomic data to provide a deeper understanding of Wisconsin’s population characteristics.
4. Does the map show any patterns in terms of age distribution?
The map provides insights into population density and distribution but does not specifically focus on age demographics. However, age-related data can be correlated with the population distribution information to analyze age-related patterns.
5. How often is the Wisconsin Population Map updated?
The Wisconsin Population Map is regularly updated, usually every five years, to reflect the latest population data available. However, minor updates may occur more frequently to address any significant demographic changes in the state.
6. Can I access and use the Wisconsin Population Map for research purposes?
Yes, the Wisconsin Population Map is freely accessible for research purposes. The cartographic team encourages its use in academic studies, spatial analysis, and demographic research, provided proper citation and usage guidelines are followed.
7. Are there similar population maps available for other states?
Yes, similar population maps are available for other states and countries. Cartographers and organizations across the world work tirelessly to create accurate and detailed population maps to aid research, planning, and decision-making processes.