Colorado Population Map
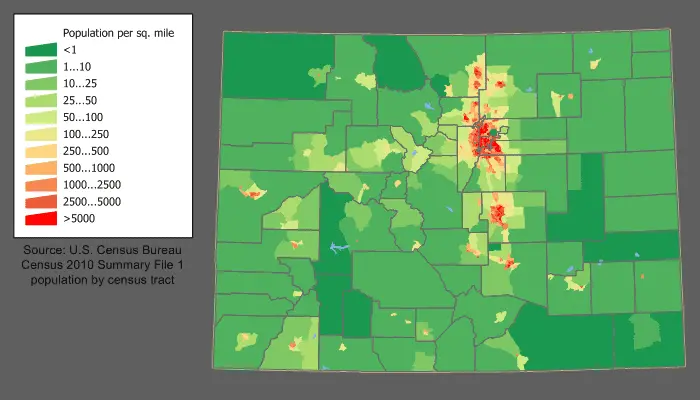
Click or tap the map to enlarge it.
Key Takeaways
- The Colorado Population Map showcases the distribution of population across different regions of Colorado.
- It provides valuable insights about population density, demographics, and growth patterns.
- The map aids in understanding the distribution of resources and the need for infrastructure development.
- It helps in effective planning, policy-making, and resource allocation.
- By analyzing the Colorado Population Map, one can identify trends and patterns to make informed decisions.
History
The Colorado Population Map has evolved over years of data collection, technological advancements, and mapping techniques. It is an essential tool for researchers, policymakers, and urban planners.
Initially, population maps relied on manual methods such as surveys, censuses, and calculations based on available data sources. Over time, advancements in technology and the availability of geospatial data have revolutionized the field of cartography.
The Colorado Population Map is a result of comprehensive census data, satellite imagery, and advanced mapping software. It provides a visual representation of population distribution, allowing for a better understanding of how the population is spread across different regions of Colorado.
Unique Insights
By analyzing the Colorado Population Map, we can gain several unique insights:
- The concentration of population in urban areas: The map highlights the high population density in major cities such as Denver, Colorado Springs, and Aurora.
- Rural population distribution: It shows the dispersion of population in rural areas, allowing us to understand the challenges and opportunities associated with rural development.
- Population growth patterns: By comparing population maps from different years, we can identify areas experiencing rapid growth and potential population shifts.
- Demographic patterns: The map can reveal demographic trends, such as age distributions, ethnic diversity, and economic disparities across regions.
Table of Facts: Population Growth in Colorado
| Year | Population (approx.) |
|---|---|
| 1950 | 1,325,000 |
| 1970 | 2,207,000 |
| 1990 | 3,294,000 |
| 2010 | 5,048,000 |
| 2020 | 5,758,000 |
FAQ
1. How is the population density calculated?
The population density is calculated by dividing the total population of an area by the land area it covers.
2. Why is the population map important?
The population map is important as it provides valuable insights about the distribution of population, aid in urban planning, and help in making informed decisions related to resource allocation.
3. Can the population map help predict future population growth?
While the population map cannot predict future growth with certainty, it can provide valuable information about historical growth patterns that can be used as a basis for projections.
4. Are there any regions in Colorado with low population density?
Yes, Colorado has regions with low population density, primarily in the mountainous and rural areas.
5. How often is the population map updated?
The population map is usually updated every few years, coinciding with the release of new census data.
6. Are there any environmental factors influencing population distribution in Colorado?
Yes, factors such as elevation, climate, natural resources, and proximity to urban centers play a role in population distribution.
7. Can the population map be used for economic analysis?
Yes, the population map can be used for economic analysis by understanding the distribution of population and demographics, enabling businesses and policymakers to make informed decisions relating to market opportunities and economic development.