Canada Population Density Map
Click or tap the map to enlarge it.
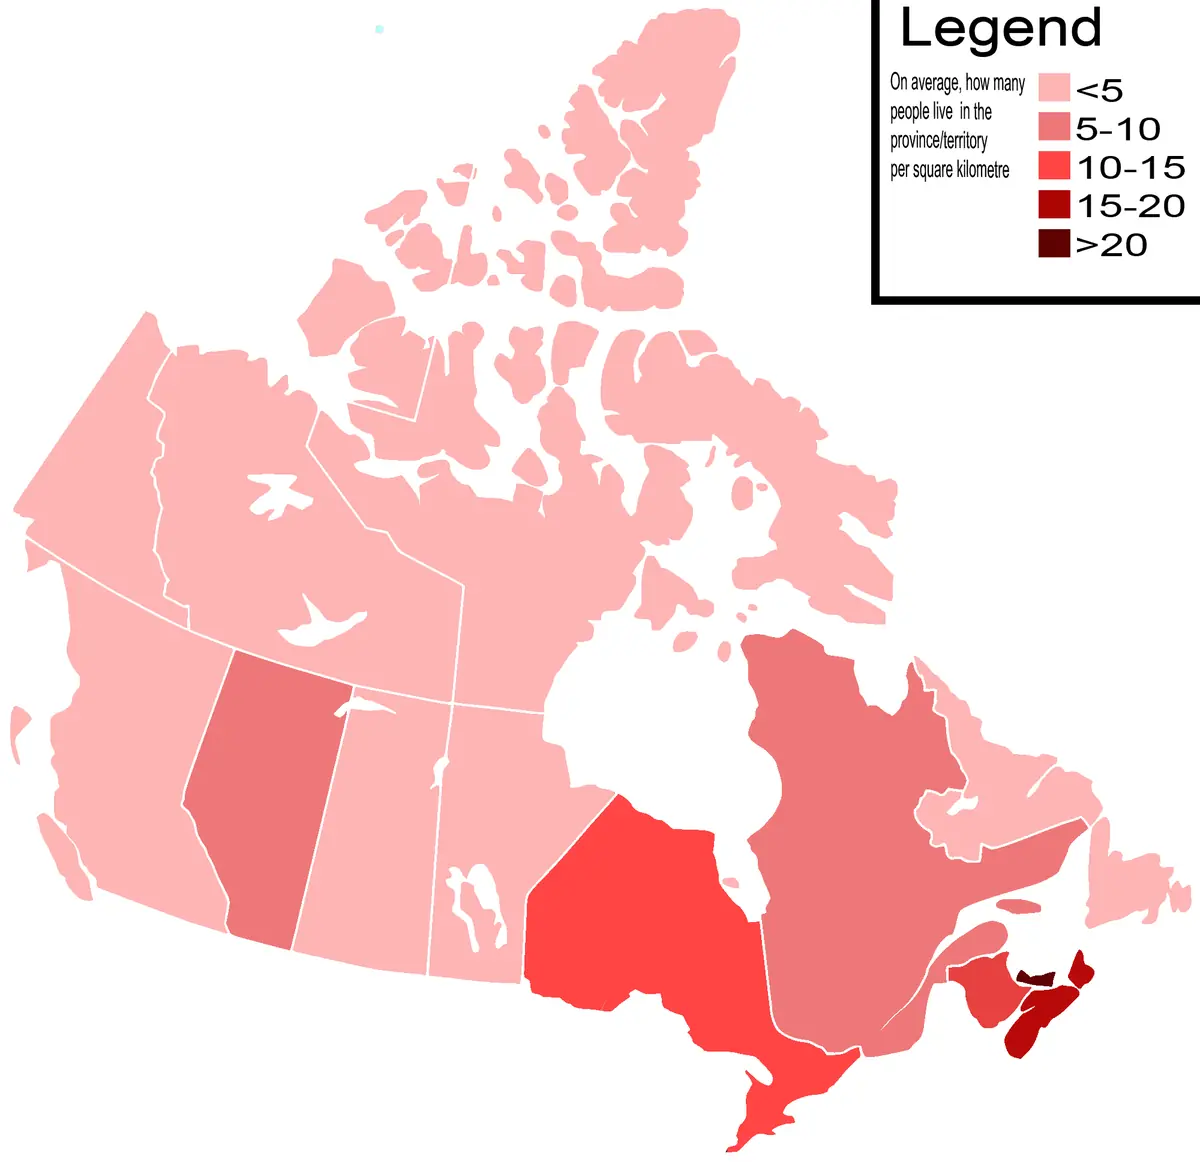
This choropleth map shades each Canadian province and territory according to its population density, with darker red for more people per square kilometre. It shows at a glance how unevenly a very large country is populated.
Canada covers almost 10 million square kilometres but had about 37 million residents at the 2021 census, an average of roughly four people per square kilometre of land.
A thin band of settlement
Most Canadians live in a corridor in the south, close to the border with the United States. The Quebec City–Windsor corridor holds Toronto, Montréal, Ottawa and Québec City, and Ontario alone accounts for more than a third of the population, with 14.2 million residents in 2021. Quebec is next at 8.5 million, followed by British Columbia at 5.0 million and Alberta at 4.3 million.
Province-level shading can hide this concentration. Northern Ontario and Quebec are much emptier than their southern parts, yet they share a colour with the cities.
The north is almost empty
Nunavut, the largest territory, has only around 40,000 people spread over about two million square kilometres, which works out to roughly one person for every 50 square kilometres. At the other end of the scale Prince Edward Island, the smallest province, is the most densely populated, with more than 25 people per square kilometre. Climate, soil and transport links explain most of the pattern.
Key facts
| Province | Population |
|---|---|
| Ontario | 14.2 million |
| Quebec | 8.5 million |
| British Columbia | 5.0 million |
| Alberta | 4.3 million |
| Canada total | 37.0 million |
Questions about this map
What is a choropleth map?
A map in which areas are shaded in proportion to a statistic, such as density or income.
Which province is the most densely populated?
Prince Edward Island has the highest density of any province.
Why does density vary so much?
Climate, terrain and economic history concentrate people in the south, while the Arctic and Subarctic north is sparsely populated.