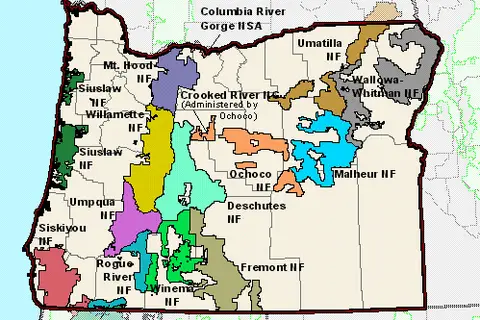
Oregon Population Map 2000
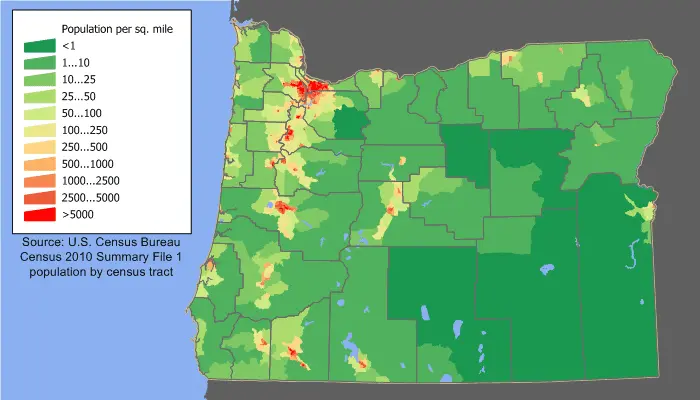
Click or tap the map to enlarge it.
Oregon Population Map 2000 – A Comprehensive Overview
Key Takeaways
- The Oregon Population Map of 2000 provides valuable insights into the distribution of population across the state during that year.
- The map helps in understanding the density of population in various regions of Oregon.
- It is a valuable resource for researchers, policymakers, and individuals interested in the demographic aspects of Oregon in the year 2000.
History
The Oregon Population Map 2000 is a result of extensive research and data collection by cartographers and statisticians. This map provides a visual representation of the population distribution across Oregon in the year 2000, giving us crucial insights into the density and concentration of people in different areas of the state during that time.
Unique Insights
- The map shows that the majority of Oregon’s population was concentrated around the metropolitan areas, such as Portland, Eugene, and Salem.
- Coastal regions like Astoria, Newport, and Coos Bay also had significant population centers.
- The eastern part of the state, including counties like Harney, Malheur, and Baker, had lower population densities compared to the western parts.
- Several cities and towns located along major highways, such as Interstate 5 and Interstate 84, showed higher population densities.
- The map also highlights some rural areas with sparse populations, particularly in the central and southeastern regions of Oregon.
Table of Facts
| County | Population | Area (sq mi) |
|---|---|---|
| Multnomah | 660,486 | 431.33 |
| Washington | 445,342 | 725.67 |
| Clackamas | 338,391 | 1,870.32 |
| Lane | 336,708 | 4,553.97 |
| Marion | 284,834 | 1,182.39 |
| Benton | 85,579 | 676.28 |
| Linn | 103,069 | 2,291.55 |
Frequently Asked Questions (FAQ)
-
How was the Oregon Population Map 2000 created?
The map was created using census data collected in the year 2000. Cartographers and statisticians analyzed the data and used geographic information system (GIS) software to visualize the population distribution across Oregon.
-
Why is the population density higher in metropolitan areas?
Metropolitan areas tend to have higher population densities due to better job opportunities, infrastructure, amenities, and cultural attractions, which attract more people to live there.
-
Which counties in Oregon had the lowest population in 2000?
Counties like Harney, Wheeler, and Gilliam had the lowest population densities in the year 2000. These counties are characterized by significant rural areas and limited economic opportunities.
-
What is the purpose of the Oregon Population Map 2000?
The map serves as a valuable resource for researchers, policymakers, and individuals interested in understanding the demographic patterns and distribution of the population in Oregon during the year 2000.
-
How can the map be utilized for urban planning?
Urban planners can use the Oregon Population Map 2000 to identify areas with high population densities, which can help with infrastructure development, transportation planning, and resource allocation.
-
Did the Oregon Population Map 2000 influence any policy decisions?
While the specific influence of the map on policy decisions cannot be determined, it likely provided important insights for policymakers in areas related to resource allocation, infrastructure development, and social services in different regions of Oregon.
-
Can the Oregon Population Map 2000 be compared to more recent population distributions?
Yes, by comparing the Oregon Population Map 2000 with more recent population data, researchers and policymakers can analyze population trends, migration patterns, and assess the effectiveness of various policy interventions.