Ussr Population Density Map 1982
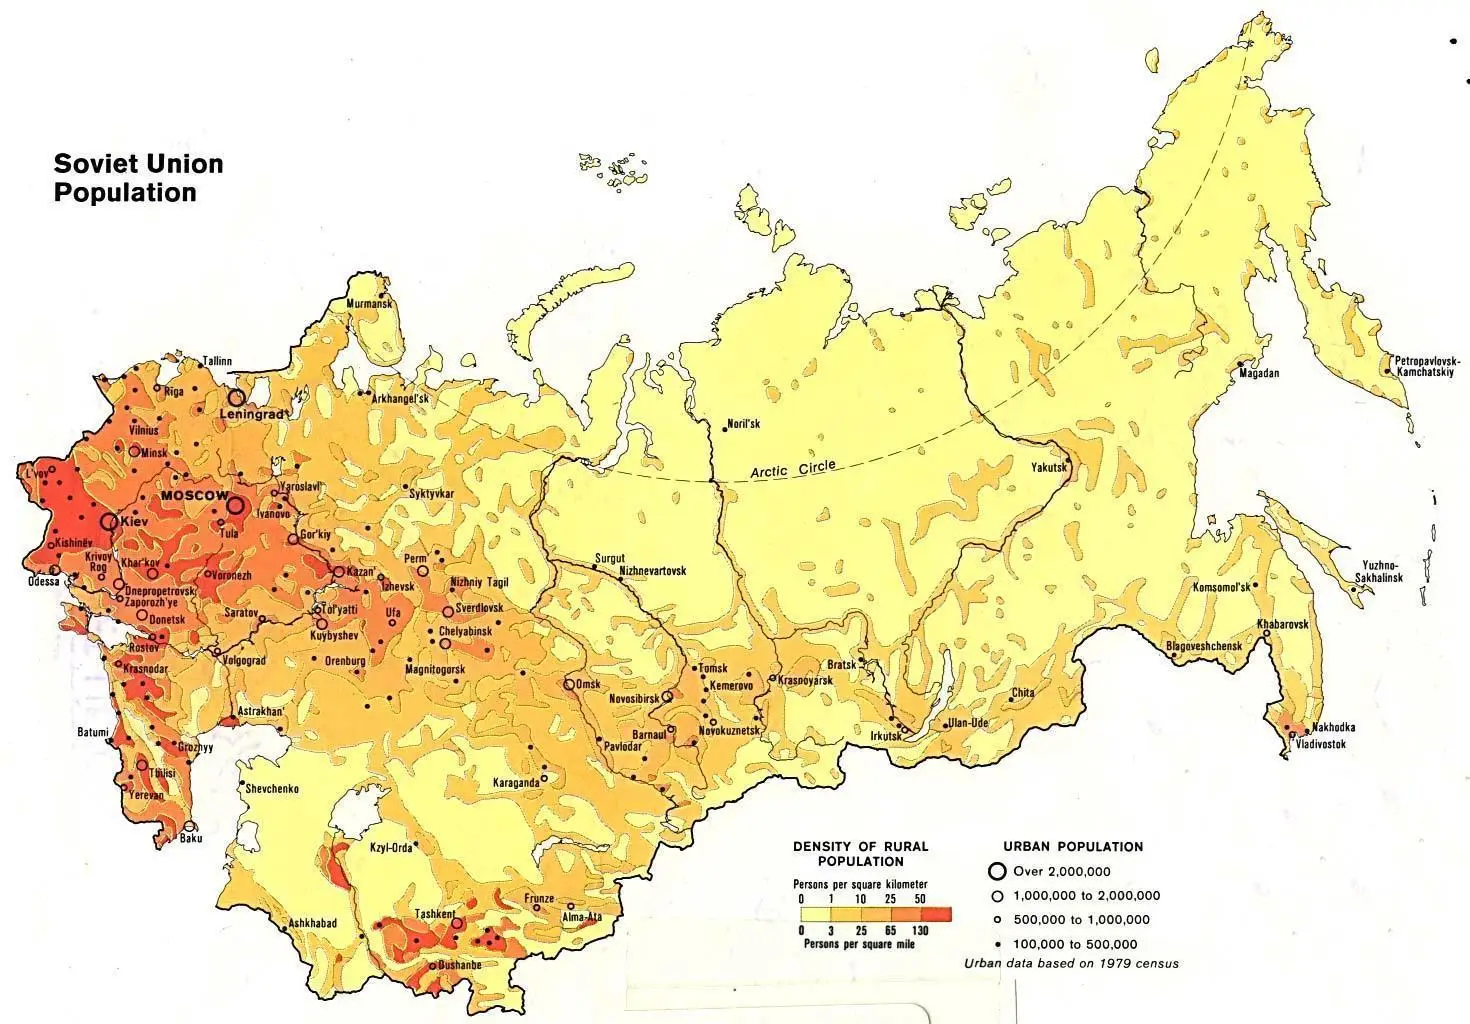
Click or tap the map to enlarge it.
USSR Population Density Map 1982
Key Takeaways
- The USSR Population Density Map of 1982 provides a visual representation of population distribution across the
Soviet Union. - This map showcases the variations in population density, highlighting areas of high and low population
concentration. - Through this map, we can gain insights into the demographic patterns and trends within the USSR during the
year 1982.
History
The USSR Population Density Map of 1982 was created during the peak of the Soviet Union’s power. The USSR, also known
as the Union of Soviet Socialist Republics, was a massive socialist state spanning Eurasia. It consisted of 15
constituent republics, with Moscow serving as its capital.
The map was developed through a comprehensive analysis of census data, surveys, and statistical records. It aimed to
provide a clear understanding of the population distribution within the USSR, which played a crucial role in
planning and resource allocation.
Population Density Insights
- The map showcases the significant variation in population density across the USSR. Urban centers and industrial
regions typically displayed higher population concentrations. - Major cities, such as Moscow, Leningrad (now St. Petersburg), Kiev, and Tashkent, exhibited dense populations and
served as essential hubs for economy, education, and culture. - Rural areas, particularly in the northern regions, exhibited lower population density due to harsh climatic
conditions, limited resources, and economic opportunities. - The Caucasus region, including Georgia, Armenia, and Azerbaijan, had notable population clusters, owing to the
historical, cultural, and geographical significance. - Siberia and the Far East, while geographically vast, had comparatively lower population densities, primarily
attributed to their remote locations and challenging living conditions. - The population density patterns depicted in the 1982 map highlight the Soviet Union’s diverse and complex
demographic landscape.
Table of Facts: USSR Population Density (1982)
| Republic | Population Density (per sq km) |
|---|---|
| Russian SFSR | 8.6 |
| Ukrainian SSR | 83.3 |
| Uzbek SSR | 50.2 |
| Kazakh SSR | 6.9 |
| Byelorussian SSR | 53.4 |
| Georgian SSR | 73.4 |
Frequently Asked Questions (FAQ)
1. What was the purpose of creating the USSR Population Density Map of 1982?
The map aimed to provide a visual representation of population distribution within the USSR in 1982. It helped
policymakers, planners, and researchers in understanding demographic patterns and guiding resource allocation.
2. Which cities within the USSR exhibited the highest population densities?
Cities such as Moscow, Leningrad (now St. Petersburg), Kiev, and Tashkent showcased high population densities,
acting as important centers of economy, education, and culture.
3. Why did rural areas in the northern regions of the USSR reflect lower population densities?
The northern regions of the USSR were characterized by harsh climatic conditions, limited resources, and fewer
economic opportunities, leading to lower population concentrations in rural areas.
4. Which regions of the USSR had significant population clusters?
The Caucasus region, including Georgia, Armenia, and Azerbaijan, exhibited notable population clusters due to their
historical, cultural, and geographical importance.
5. What factors contributed to the lower population densities in Siberia and the Far East?
Siberia and the Far East had comparatively lower population densities due to their remote locations and challenging
living conditions, making them less attractive for settlement.
6. How did population density vary between urban and rural areas within the USSR?
Urban areas and industrial regions typically displayed higher population densities, while rural areas showed lower
population concentrations. This was a result of better employment opportunities and access to resources in urban
centers.
7. How does the USSR Population Density Map of 1982 help in understanding the demographic landscape of the Soviet
Union?
The map provides valuable insights into population patterns, showing the complex demographic landscape of the USSR
during 1982. It helps researchers and historians gain a better understanding of the societal dynamics and aid in
comparative analysis.