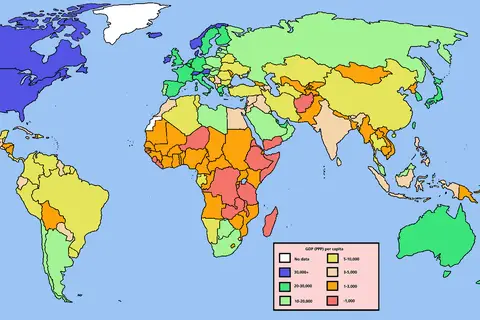
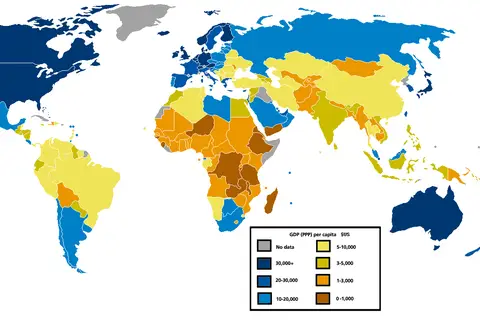
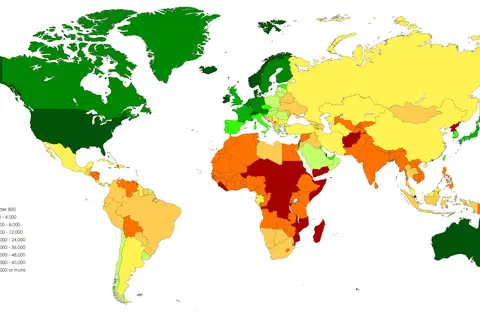
World Map of Median Wealth Per Adult by Country Credit Suisse 2019 Publication
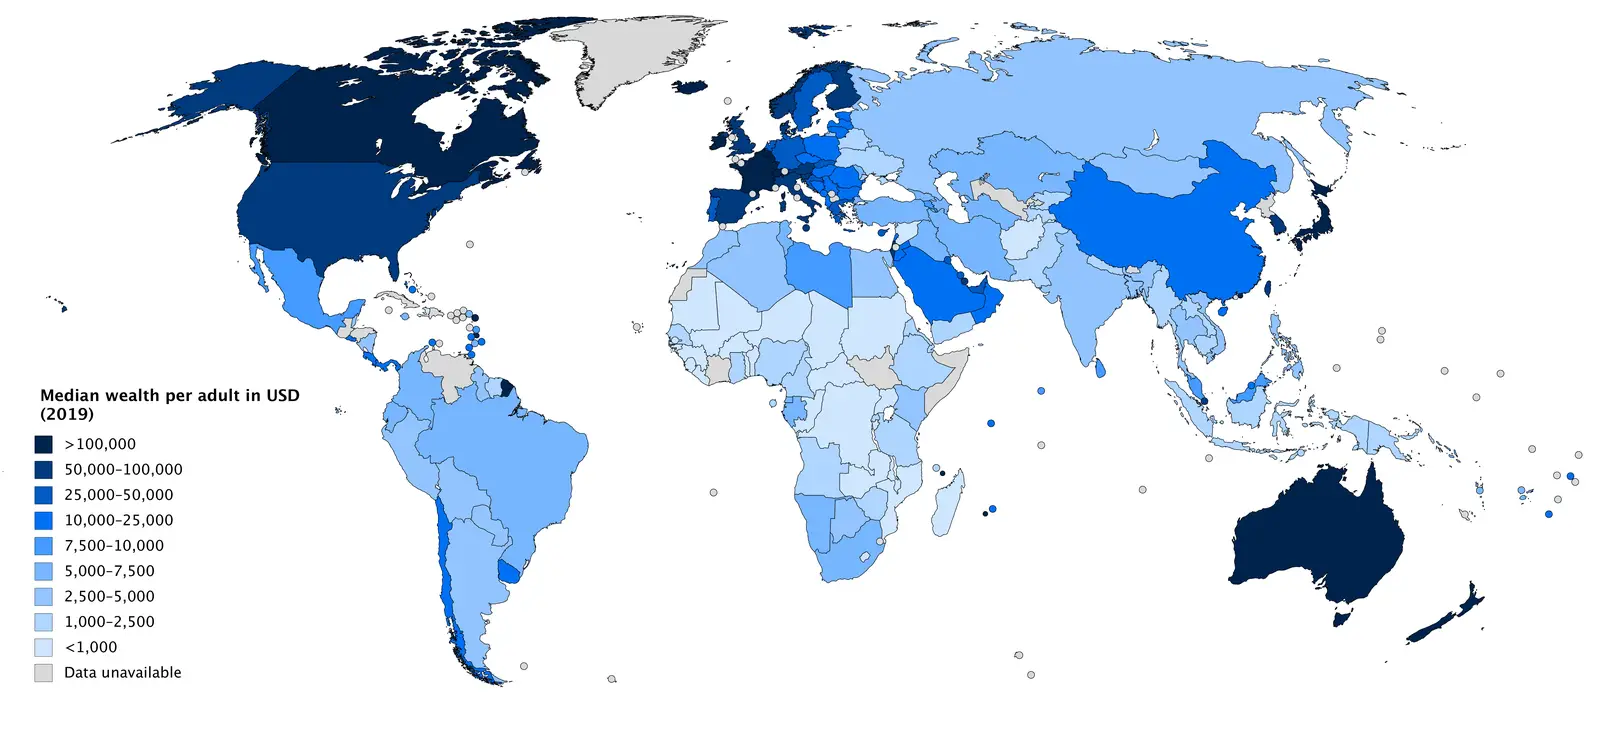
Click or tap the map to enlarge it.
Key Takeaways
- The “World Map Of Median Wealth Per Adult By Country Credit Suisse 2019 Publication” provides valuable
insights into the wealth distribution across different countries. - This map visually represents the median wealth per adult in each country, allowing easy comparison
between nations. - Credit Suisse’s 2019 publication offers a comprehensive picture of global wealth disparities.
History
The “World Map Of Median Wealth Per Adult By Country Credit Suisse 2019 Publication” is a result of extensive
research conducted by Credit Suisse, one of the world’s leading financial institutions. The study examines
the median wealth per adult for each country, which provides a more accurate measure of wealth distribution
compared to mean wealth. By considering the median, outliers or extreme cases do not skew the results.
Credit Suisse’s publication takes into account various key factors such as financial and non-financial assets,
including property, investments, and debts. This holistic approach allows for a comprehensive understanding
of wealth distribution.
The study’s findings shed light on the economic disparities between countries. It reveals the uneven
distribution of wealth and the significant gaps in prosperity across different regions of the world.
Unique Insights
- The map demonstrates that wealth distribution is highly varied across different continents, with some
countries significantly outperforming others. - Developed countries generally have higher median wealth per adult, reflecting their economic stability
and opportunities for wealth accumulation. - Many African and South American countries exhibit lower median wealth, highlighting economic challenges
faced by these regions. - There are substantial disparities in wealth distribution within continents as well. For example, while
countries in Western Europe generally have high median wealth, Eastern European countries tend to have
lower figures. - Countries with significant natural resources often have higher median wealth due to their ability to
leverage these resources for economic gain. - Political stability, income inequality, and access to education and healthcare are some of the factors
influencing wealth distribution.
Table of Relevant Facts
| Country | Median Wealth per Adult (USD) |
|---|---|
| United States | 65,904 |
| Switzerland | 227,891 |
| Australia | 181,361 |
| Japan | 103,861 |
| South Africa | 7,260 |
| India | 2,983 |
| Brazil | 5,411 |
FAQ
1. What is median wealth per adult?
Median wealth per adult is the value that divides the wealth distribution into two equal halves. It represents
the amount that an average adult would have if the entire wealth of the country was evenly distributed among
the population.
2. How is the median wealth per adult calculated?
Credit Suisse calculates the median wealth per adult by analyzing various financial and non-financial factors,
including assets such as property and investments, and factors in debts such as mortgages and loans.
3. Why is median wealth per adult a better measure than mean wealth?
Median wealth per adult provides a more accurate measure of wealth distribution because it is not affected
by extreme outliers or individuals with significantly higher or lower wealth.
4. What factors contribute to the disparities in wealth distribution?
Various factors contribute to wealth distribution disparities, including economic stability, political
stability, income inequality, access to education and healthcare, and natural resources.
5. Why do developed countries generally have higher median wealth per adult?
Developed countries typically have higher median wealth per adult due to their stable economies, better
opportunities for wealth accumulation, and overall higher standards of living.
6. How do natural resources influence median wealth per adult?
Countries with significant natural resources often have higher median wealth per adult as they can leverage
these resources for economic gain through exports and increased investment.
7. Can wealth distribution change over time?
Yes, wealth distribution can change over time due to various economic, social, and political factors. Changes
in government policies, economic growth or recession, and shifts in societal expectations can all impact
wealth distribution.
External Links
LSI Keywords
- World map of wealth distribution
- Global wealth disparities
- Median wealth per adult by country
- Credit Suisse 2019 publication
- Economic disparities between nations
- Wealth distribution analysis
- Mean wealth vs. median wealth
- Income inequality and wealth distribution
- Factors affecting wealth distribution
- Natural resources and wealth accumulation