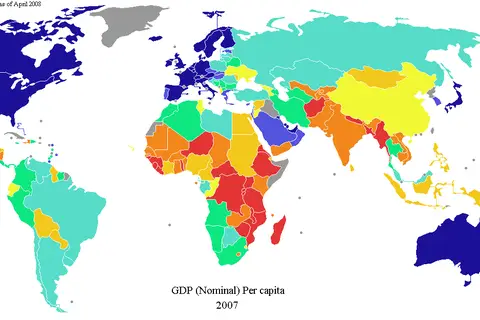
World Trade Map
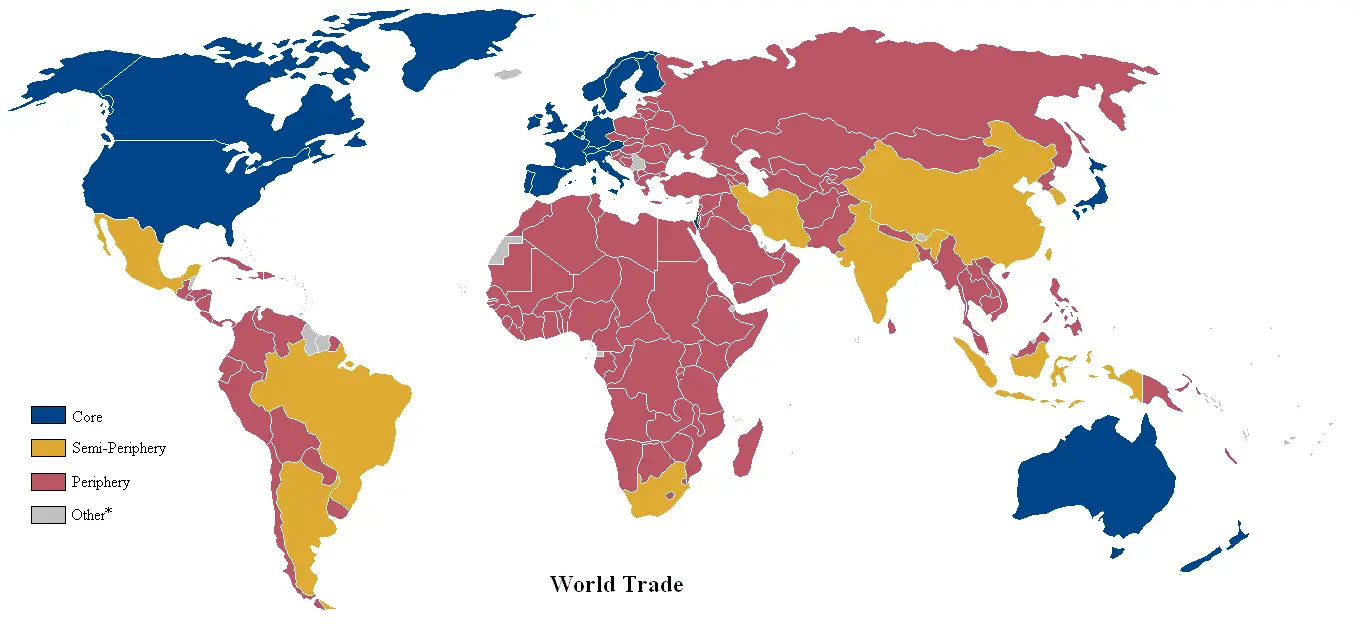
Click or tap the map to enlarge it.
Key Takeaways
- The World Trade Map reveals the intricate network of global trade routes.
- It provides valuable insights into the international flow of goods and services.
- The map highlights major trade hubs and transportation corridors around the world.
- Understanding the World Trade Map aids in strategic decision-making for businesses and policymakers.
History of the World Trade Map
The World Trade Map has a rich history dating back centuries. As trade routes expanded and exploration flourished, cartographers began to document the connections between nations and continents. The first rudimentary world trade maps emerged during the Age of Discovery in the 15th century.
During the 16th and 17th centuries, explorers such as Christopher Columbus, Vasco da Gama, and Ferdinand Magellan mapped out new trade routes, linking Europe with various parts of the world. These early maps laid the foundation for future cartographers to improve the accuracy and level of detail in world trade mapping.
In the 19th and 20th centuries, advancements in transportation, such as steamships and railways, revolutionized global trade. This, in turn, prompted cartographers to create more sophisticated and comprehensive world trade maps to keep up with the increasing complexity of international trade.
Unique Insights from the World Trade Map
The World Trade Map offers several unique insights into global commerce:
1. Geographical Concentration of Trade
By studying the map, we can observe that trade is concentrated in certain regions, such as Europe, North America, and East Asia. These areas serve as major trading hubs due to their strategic location, robust economies, and well-developed transportation infrastructure.
2. Interconnectivity between Trade Routes
The map showcases the interconnectivity between different trade routes. It highlights how goods and services flow between regions and continents, fostering economic integration and cultural exchange.
3. Emerging Trade Routes
The World Trade Map provides insights into emerging trade routes. It helps identify new areas of opportunity for businesses, as well as potential challenges and risks associated with developing trade corridors.
4. Impact of Political Factors on Trade
Certain political factors, such as trade policies, tariffs, and geopolitical tensions, significantly influence global trade patterns. Analyzing the World Trade Map can shed light on the impact of these factors on the movement of goods and services.
Table of Relevant Facts
| Year | Significant Event |
|---|---|
| 1492 | Christopher Columbus discovers the Americas, opening new trade routes. |
| 1498 | Vasco da Gama reaches India by sea, establishing a direct trade link between Europe and Asia. |
| 1519 | Ferdinand Magellan embarks on the first circumnavigation of the globe, proving the Earth is round, and furthering global trade. |
| 1869 | The Suez Canal is completed, dramatically reducing the travel time for ships traveling between Europe and Asia. |
| 1914-1918 | World War I disrupts global trade, causing economic instability and shifting trade routes. |
| 1956 | The closure of the Suez Canal during the Suez Crisis leads to the diversification of trade routes. |
| 1995 | The World Trade Organization (WTO) is established, promoting global trade liberalization. |
Frequently Asked Questions (FAQ)
1. What is the purpose of the World Trade Map?
The World Trade Map serves as a comprehensive visual tool to understand global trade routes and patterns.
2. How can businesses benefit from studying the World Trade Map?
Businesses can identify potential markets, optimize their supply chains, and make informed decisions about expanding their operations based on the insights provided by the map.
3. Are all trade routes depicted on the World Trade Map?
The map presents major trade routes, but it may not include every minor route. Its primary focus is on illustrating the main trade corridors.
4. Can individuals use the World Trade Map?
Absolutely! The World Trade Map is a publicly available resource that can be used by anyone interested in studying global trade connections.
5. Are trade routes constantly changing?
Yes, trade routes are influenced by various factors such as economic trends, political developments, and technological advancements. The World Trade Map is regularly updated to reflect these changes.
6. How can policymakers use the World Trade Map?
Policymakers can analyze the map to understand the impact of their decisions on trade patterns, identify areas for trade promotion, and develop strategies to enhance economic cooperation with other nations.
7. Can the World Trade Map help predict future trade developments?
While the map provides insights into existing trade routes and trends, predicting future developments requires a comprehensive analysis of multiple factors beyond the data presented on the map.